

What Happened, Why, and Will It Happen Again
A long CIP step is a symptom, not a cause. How we build process reports that go from what happened, to why, to what to check before it fails.


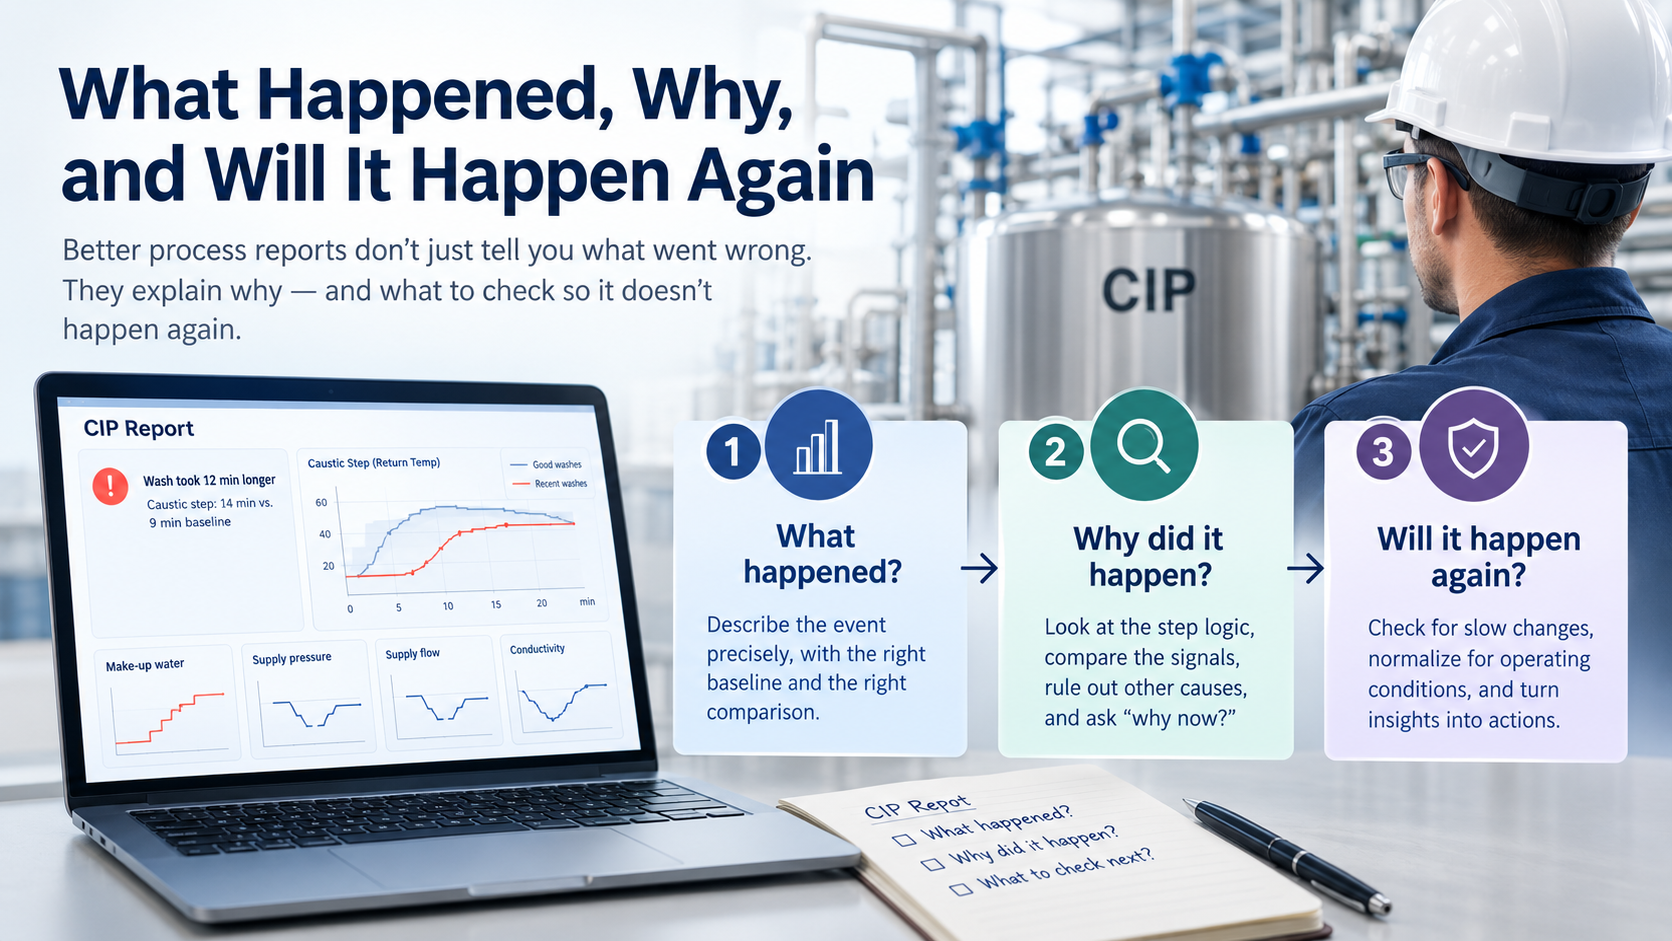
Most process reports tell you something went wrong. Fewer tell you why, and almost none tell you what's likely to go wrong next.
"Your caustic step ran 5 minutes over" is true, but it doesn't help much. The operator already knows the wash took longer. Maintenance can't do anything with it. The plant manager gets one more number with no decision attached.
Over the last few weeks we've rebuilt our reports around three questions, always in the same order:
- What happened?
- Why did it happen?
- What should you check so it doesn't happen again?
Here's what each phase involves in practice, using a CIP example that combines several recent washes.
Phase 1: What happened
The first job is stating the event precisely enough that it can be explained. "CIP was slow this week" isn't that. This is:
On circuit 2, caustic recirculation ran 14 minutes against a 9-minute baseline on three of the last five washes. Pre-rinse, acid and final rinse stayed within their normal range. Total wash time went up by 12 minutes on those three washes, with the extra 2 minutes coming from a longer drain.
Three things make that statement useful.
It compares against the right baseline. "Normal" here means the same circuit, the same recipe and the same object being cleaned, taken from washes that passed. Comparing circuit 2 against a plant-wide average would hide the problem or invent one.
It's aligned by step, not by clock time. Washes don't start at the same time or run the same length, so overlaying them by timestamp doesn't tell you much. Aligning every wash to the start of each step lets you compare the caustic phase of Tuesday's wash directly with the caustic phase of 40 good washes.
It uses a range, not an average. A 9-minute baseline means little without the spread. If good washes run from 8 to 10.5 minutes, then 14 is clearly outside. If they run from 7 to 15, it isn't a finding.
Most monitoring setups can get close to this with thresholds and a dashboard. It's necessary, but it's only the starting point.
Phase 2: Why it happened
This is where the report earns its place. A step running long is almost never the root cause. It's the result of something upstream.
Start with what the step logic is waiting for
The first question is always what ends the step. In this case, caustic recirculation holds until return temperature and return conductivity both reach setpoint, then runs a fixed hold time. So the step logic was doing exactly what it was designed to do. The real question becomes why temperature and conductivity took longer to get there.
That reframing matters. It moves the investigation away from "the CIP system is slow" and toward two specific signals and everything that drives them.
Line up the signals against good washes
Comparing the three long washes with the good baseline, step-aligned, showed a clear sequence:
- A make-up water addition happened at the start of the caustic step on all three long washes. It was present in only a few of the good ones.
- Supply pressure dropped at the same moment, and supply flow fell below target for the first several minutes.
- Return temperature took longer to climb. Cold make-up water plus lower flow through the heat exchanger meant the circuit needed more time to come up to temperature.
- Conductivity dipped and recovered slowly. The added water diluted the solution, the dosing pump ran longer to bring concentration back, and conductivity reached setpoint several minutes late.
So the long step came from a chain of events: extra water went in, pressure and flow dropped, temperature and concentration both took longer to recover, and the step held until they did.
Rule out the other explanations
A convincing story isn't the same as the right one, so the report also checks the obvious alternatives:
- Sensor issues. A fouled conductivity probe can read low and hold a step open. Here, the conductivity recovery lined up with dosing pump runtime, and the probe read normally on the acid step, so the sensor was unlikely to be the cause.
- Soil load. Heavier soiling from a longer production run can extend a wash. Production run lengths before the three long washes were in the normal range.
- Manual intervention. There were no manual holds or step advances in the event log.
- Recipe changes. Setpoints and hold times were unchanged.
Writing down what was ruled out is part of the report too. It saves the plant team from chasing the same alternatives themselves.
Ask "why now?"
This is the question that connects Phase 2 to Phase 3. Make-up water additions weren't new. They showed up in a handful of good washes as well, and on those washes the step still finished on time. So why did the same event cause a 5-minute overrun on the recent washes but not on the earlier ones?
The answer came from looking at the trend, not the single event: the circuit had less margin than it used to. That leads straight into the reliability section.
Phase 3: Reliability
The third phase looks forward. While explaining this week, the data often shows slow changes in the equipment that haven't turned into a problem yet.
Normalize for how the equipment is being run
Raw trends are misleading because operating conditions change from wash to wash. A pump's discharge pressure depends on the circuit, the valve line-up and the flow demand, so plotting it over time mixes equipment condition with how it was being used.
The useful comparison holds conditions constant: at the same circuit, same valve positions and same flow setpoint, how much pressure does the supply pump make today compared with six weeks ago?
On this circuit, the answer was about 8% less, with a steady decline and no step change. That's not enough to trip an alarm, and it isn't something anyone would notice during a normal shift. But it's consistent, and it explains the "why now." A healthy pump had enough margin to absorb the pressure drop from a make-up water addition. A pump running 8% below where it was couldn't, so flow fell below target and the rest of the chain followed.
Check the rest of the circuit the same way
The same normalized approach runs across the other equipment in the loop:
- Heat exchanger: steam valve position needed to reach the same temperature at the same flow. Rising valve position over time points to fouling. (Stable on this circuit.)
- Dosing: dosing pump runtime per unit of conductivity rise. An increase can mean a weak pump, a partially blocked line or a concentration issue in the chemical supply. (Stable.)
- Return side: return pump and scavenge performance, which shows up as longer drains and tank level recovery. (Slightly worse, consistent with the 2 extra minutes of drain time, and worth watching.)
Make the recommendation specific
A reliability finding is only useful if someone can act on it. The report ends with something like this:
Check at next scheduled stop: supply pump on circuit 2. Inspect the suction strainer first (quickest check, and a common cause of gradual pressure loss), then impeller and wear ring condition if the strainer is clean.
Watch: return side drain times. Not actionable yet, but trending in the same direction.
Consider: moving the make-up water addition out of the start of the caustic step, which removes the trigger even before the pump is serviced.
Each item names the equipment, says what to look at and in what order, and ties it to a planned stop instead of creating an emergency. It also separates what needs action now from what just needs watching.
Close the loop
The report doesn't finish when the recommendation goes out. After the strainer is cleaned or the pump is serviced, the next report checks the same normalized pressure trend. If it goes back to baseline, the finding is confirmed and the caustic step should return to normal even when make-up water is added. If it doesn't, the first hypothesis was wrong, and that's useful information as well.
This feedback is what builds trust in the reports over time. Recommendations that can be checked, and are, get acted on faster the next time.
Why the order matters
Each phase depends on the one before it:
- What without why creates noise: a list of deviations with no way to tell which ones matter.
- Why without what is analysis with no anchor, and nobody knows which event it explains.
- Reliability without the first two reads like a generic maintenance tip. When it follows a specific event and a specific cause, it's credible and it gets acted on.
The fixed structure also makes the reports easy to read week to week. Once people know where to look, they can go through a report in a couple of minutes and know whether anything needs their attention.
What it takes
None of this needs exotic data. For a CIP circuit, the core signals are usually already in the PLC or historian: step number, supply and return temperature, return conductivity, supply pressure and flow, tank levels, valve and pump states, dosing pump status and steam valve position. A few weeks of history is enough to build a baseline, and a few months makes the drift trends reliable.
The hard part is the work in between: aligning every wash by step, comparing it against the right baseline, testing alternative explanations and normalizing trends for operating conditions, then doing it again for every wash on every circuit. People can do this, but it takes hours per wash, which is why it rarely happens outside a formal investigation. It's exactly the kind of work that should be automated, so engineers spend their time on the recommendation instead of on assembling the data.
Beyond CIP
We started with CIP because the steps are well defined and the cost of a long wash (water, chemicals, energy and lost production time) is easy to measure. But the structure carries over to any process with a normal pattern to compare against:
- Pasteurizers: a diversion event (what), traced to a holding tube temperature dip after a flow change (why), with a trend in heating section approach temperature pointing to plate fouling (reliability).
- Membrane systems: a drop in flux (what), linked to feed temperature and concentration changes (why), with normalized permeability decline showing when cleaning is really needed (reliability).
- Fillers: a spike in short stops (what), tied to a specific format and upstream supply gaps (why), with a slow rise in cycle time variability on one station pointing to mechanical wear (reliability).
The question stays the same every time. Don't stop at what went wrong. Get to why, then to what to check next.
Want to learn more?
Fallstudien
Wie führende Unternehmen ihre Geschäftstätigkeit transformieren
Beispiele aus der Praxis für betriebliche Exzellenz, die durch unsere Plattform erreicht wurde
Erzielen Sie messbare Ergebnisse.
Ohne ein großes IT Projekt.